Infrastructure Damage Assessment
Infrastructure localization and change detection
Introduction
This solution uses AI models to assess infrastructure damage from satellite imagery. It includes two main components: a localization model that segments images into background, roads, and buildings, and a change detection model that compares pre- and post-disaster images to classify areas by damage. The system produces visual outputs by overlaying model predictions on satellite images, helping to identify affected areas and assess the extent of damage.
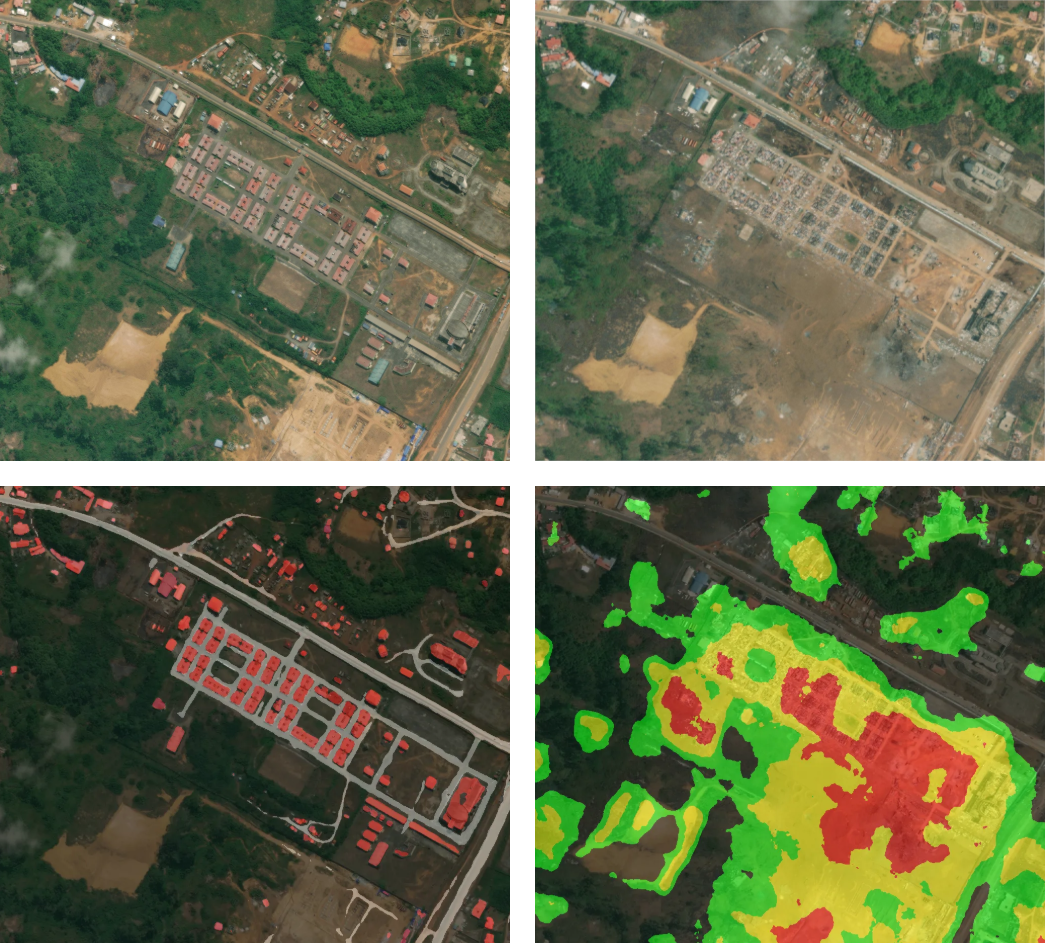 In figure: Example of a damage map generated by the change detection model. Pre-event image on the top-left, post-event image on the top-right, infrastructure localization map on the bottom-left (gray is road, red is building), and change map on the bottom-right (black if less than .25, green if between .25 and .5, yellow if between .5 and .75, and red if greater than .75).
Key Features
- Infrastructure Localization Map: Automatically segments satellite imagery into key infrastructure classes—background, roads, and buildings—enabling mapping and monitoring of built environments.
- Change Detection Map: Compares pre- and post-event imagery to generate a continuous damage map, where pixel values range from 0 (no change) to 1 (complete destruction), supporting analysis of structural impact and recovery needs.
Technologies Used
- VHR Remote Sensing Imagery: Multi-temporal Maxar Images. Paper
- Computer Vision: UperNet with ConvNeXt-based encoder. Paper
Use Cases
This solution is designed for a range of post-disaster and urban monitoring applications. It can support emergency response teams in rapidly identifying damaged infrastructure, assist urban planners in tracking structural changes over time, and aid humanitarian organizations in prioritizing areas for relief.
Live Demo
Input
The system takes a pair of satellite images—one captured before and one after a disaster event. These images should be aligned and cover the same geographic area.
Output
The output includes two masks:
- A segmentation mask showing infrastructure classes (background, roads, buildings).
- A damage map with pixel values indicating the severity of change, from 0 (no change) to 1 (destroyed).
Try it out
Try out the solution in real time on Hugging Face Spaces:
Integration
You can integrate this solution into your own workflows using the pre-trained infrastructure localization and change detection models. The model weights, which contain the learned parameters, are publicly available for download from our Hugging Face repository.
By accessing these weights, users can deploy the models for inference on aligned pairs of satellite images, enabling automated infrastructure mapping and damage assessment within their own systems or applications.