Customer Churn Survival Analysis
Customer Churn Prediction and Explainability
Introduction
This demo showcases two main tools to analyse the churn phenomenon within a business context, such as a bank. These tools were developed within a project in collaboration with HYPE S.p.A, an online bank interested in exploring ways to improve its customer retention strategy, starting with the analysis of which customers are most likely to close the account (churn) and when this is likely to occur. The solution leverages traditional machine learning models to classify the customers and Explainable AI techniques to give insights in the categorization as churner or non-churner. It also studies the risk related to the phenomenon, individually for each customer, through Survival Analysis models.
Note: the data was taken from Kaggle, and represents a simple example of the pipeline application, as the data used during the project was strictly hosted by the bank.
Key Features
- Supervised Machine Learning: Classifies each customer into “churner” or “non-churner”
- Explainable AI: Uses SHAP values to determine the impact each feature had in the specific classification of a customer
- Survival Analysis: Through the estimation of the survival probability distribution for each customer, it allows to analyse the churn risk for each customer over a given time window
- Real-time analysis: Immediate analysis of a customer’s position
Technologies Used
- Python: Core programming language with libraries such as NumPy, Scikit-learn, Matplotlib
- Machine Learning: XGBoost Classifier used for Churn Prediction
- Explainable AI: SHAP values describing the positive/negative impact of each feature on the classification of a specific customer
- Survival Analysis: Cox Proportional Hazards Model to estimate survival probability and risk, separately for each customer
Use Cases
This analysis of the churning tendencies of the customer base can be applied to any kind of business that provides a “subscription” service.
Live Demo
Input
Tabular data containing several kinds of customer information. Each row corresponds to a single customer, with demographics features, information regarding their position within the bank (e.g. how many products they use, current balance, activity status). An indication of whether the customer has churned or not is needed, as well as the time of survival, i.e. the number of days/weeks/months/years from account’s opening until its closure, or until now.
How it works
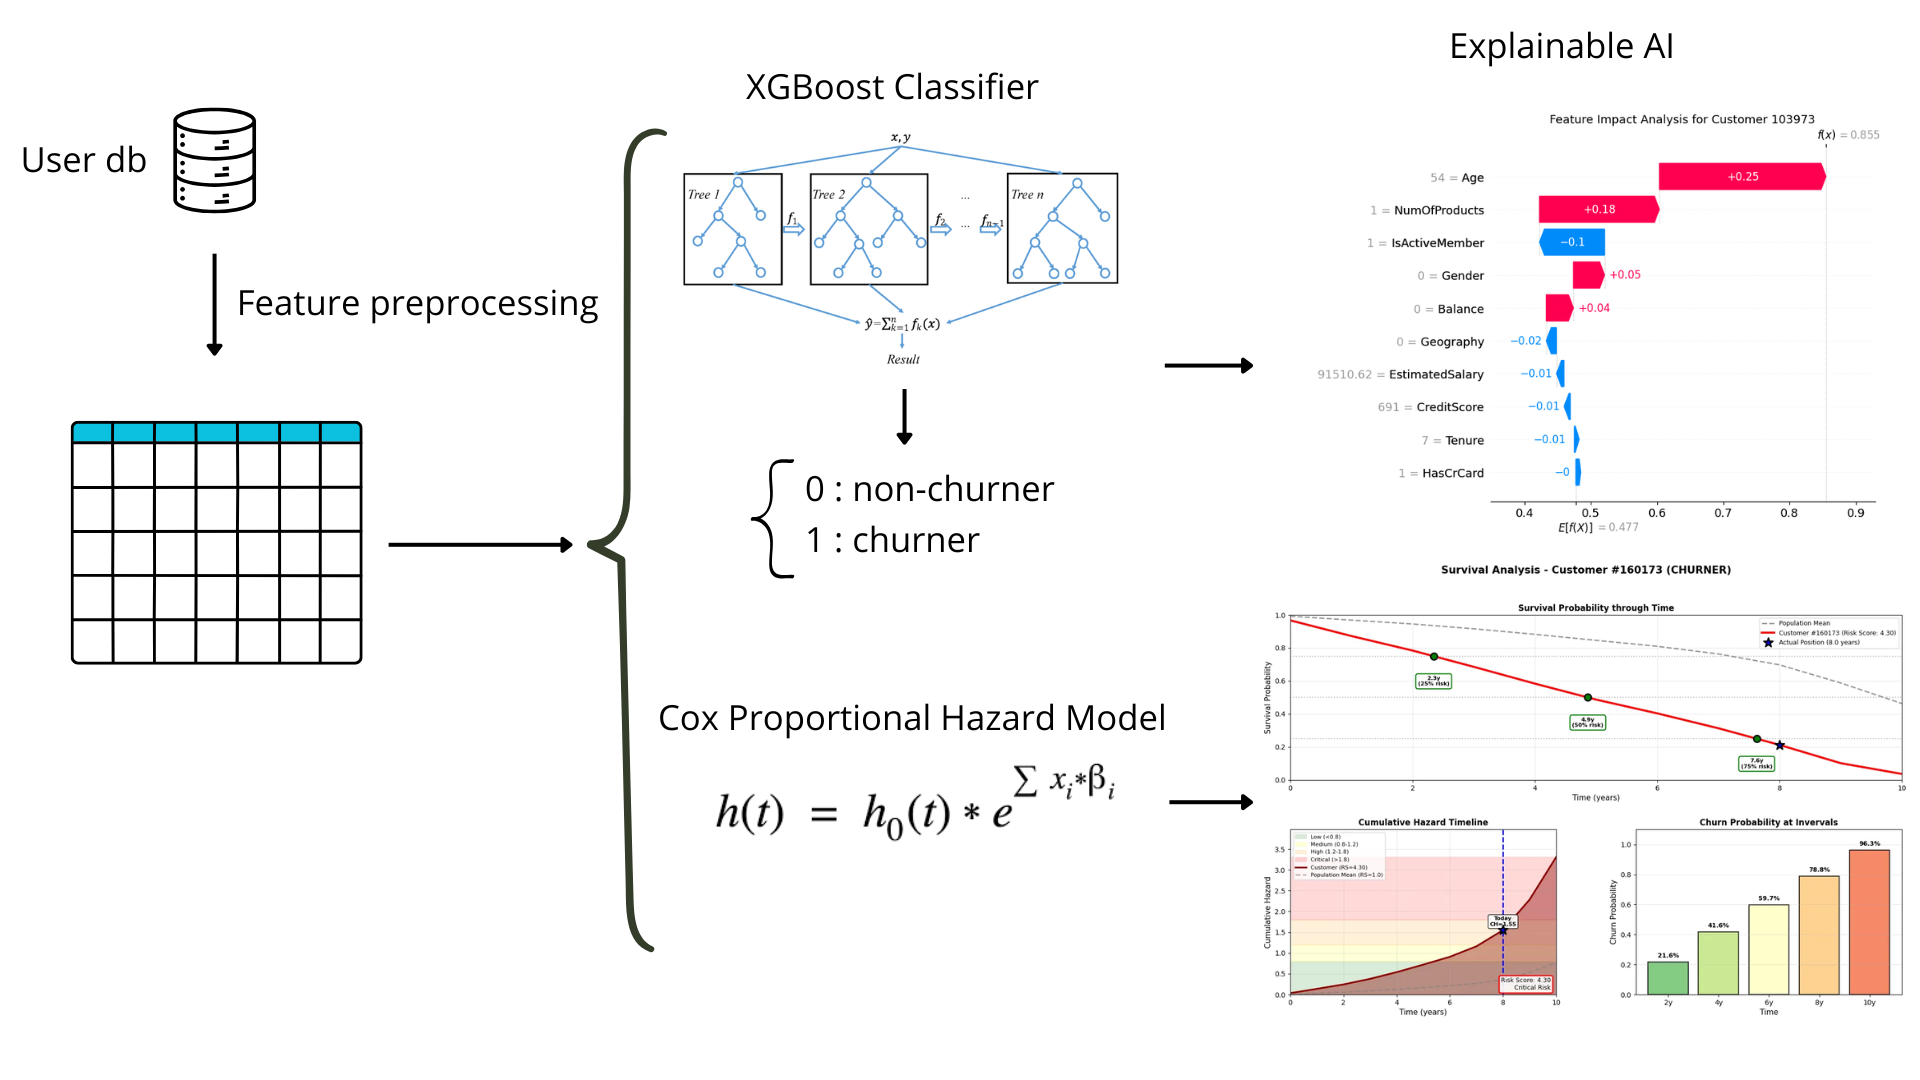
The Customer Churn Survival Analysis system works in two phases:
- An XGBoost Classifier is trained to learn how to distinguish between churners and non-churners, thanks to the patterns characterising the data. At inference time, after the assignment of a label to each test customer, an analysis through the SHAP values is conducted: it is assessed whether a specific feature contributed positively or negatively to the churn classification. Looking at the value that each feature assumes for a customer and at its impact, it is possible to understand why the model classified the customer in a certain manner, and based on this potential customer retention strategies can be designed.
- A Cox Proportional Hazards Model is trained to compute the estimates of the baseline hazard to be used when computing the survival probability and risk distributions. For each customer, the model provides: an estimate of the risk associated to it becoming a churner, an estimate of the cumulative hazard distribution and of the cumulative survival probability through a time frame determined according to the time indication in the training set.
Output
After choosing to analyse a random customer, or selecting a specific one from the database, the demo visualizes:
- A SHAP plot representing the impact of each feature in the classification of the customer as a churner or a non-churner
- A survival probability plot, representing the likelihood of surviving (i.e. keeping the account open) through time, with visualizations of 3 risk levels; a cumulative hazard plot, representing the evolution of the risk of churning through time, with visualizations of 4 risk levels; a bar plot representing the likelihood of churn in four phases.
Try it out
Try out the solution in real time on Hugging Face Spaces:
Benefits
- Improvement in understanding why a customer may churn
- Allows timely customer retention interventions by analysing the churn risk
- Improvement in customer retention strategies
Integration
The original implementation was developed in proprietary environments. The refactored code can be taken and implemented wherever possible.