Beehive Localization
Automated detection and geolocation of individual beehives in very-high-resolution aerial and satellite imagery
Introduction
Beehives are extremely sparse across the large geographic extents covered by very-high-resolution (VHR) imagery, which makes manually finding them impractical at scale. This solution automatically detects and geolocates individual beehives in VHR RGB imagery acquired from satellite and aerial surveys.
The system is built as a two-stage detection cascade. A binary patch classifier first labels each image tile as either apiary-containing or background, and a keypoint-detection model then runs only on the positive tiles to pinpoint the precise location of each individual beehive. Cascading the two models keeps inference cheap, since the heavier localization network processes only the small fraction of patches flagged as positive rather than the entire scene. The service is integrated into the SAiBees platform for automated processing of new imagery.
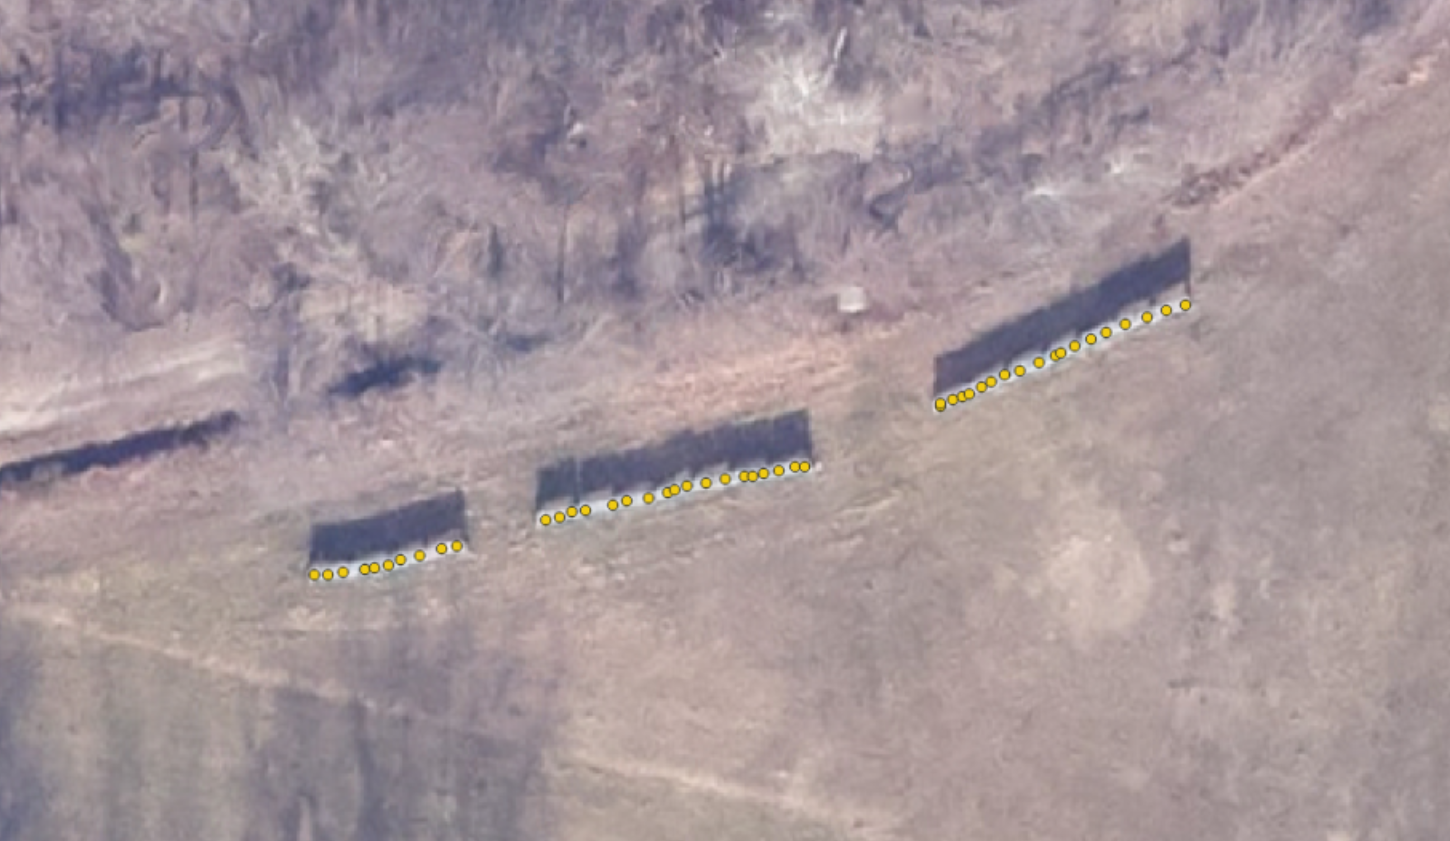 In figure: sample output of the beehive localization model. Yellow dots indicate detected beehives.
Key Features
- Two-stage cascade: A lightweight patch classifier filters out background before the heavier localization model runs, keeping inference fast over wide areas.
- Precise geolocation: Each beehive centroid is recovered as a peak in a predicted heatmap, giving individual point locations rather than coarse region flags.
- Robust to false positives: The localization stage is trained on a small share of beehive-free patches so it learns to suppress false positives propagated from the classifier upstream.
- Wide geographic coverage: Trained on imagery spanning five countries (Austria, France, Germany, Italy, Spain), supporting generalization across regions.
- Model-assisted annotation: A human-in-the-loop labelling procedure uses model predictions as a starting point, which are then manually verified, enabling efficient dataset expansion.
Technologies Used
- Deep Learning & Computer Vision: Neural network models for image classification and keypoint detection, implemented in PyTorch.
- Patch Classification: A Vision Transformer (ViT) initialised with DINOv3 pre-trained weights.
- Beehive Localization: An EfficientNet-b4 encoder with a U-Net decoder, trained as single-class heatmap regression with an MS-SSIM loss.
- Remote Sensing: Optimised for VHR RGB imagery at roughly 14 cm/pixel, from both satellite and aerial acquisitions.
Use Cases
- Apiary mapping and census: Locate and count beehives across large areas without manual photo-interpretation.
- Beekeeping monitoring: Support registries and territorial monitoring of apiary distribution over time.
- Environmental and agricultural analysis: Provide georeferenced apiary locations as an input for downstream spatial analysis.
How It Works
The pipeline processes VHR RGB imagery in two stages:
- Patch classification: The scene is split into patches, and a binary classifier labels each one as apiary-containing (positive) or background (negative). Because apiaries are so sparse, training uses a dynamic patch-sampling strategy that enforces a balanced split between positive and negative samples.
- Beehive localization: Only the positive patches are passed to the keypoint-detection model, which predicts a heatmap with Gaussian peaks centred on individual beehives. Peak coordinates are recovered from the heatmap to give each beehive’s precise location.
The complete pipeline reaches an F1 score of around 80%. Evaluated on an NVIDIA A100 GPU, the end-to-end pipeline processes one square kilometre in as little as 6.6 seconds.
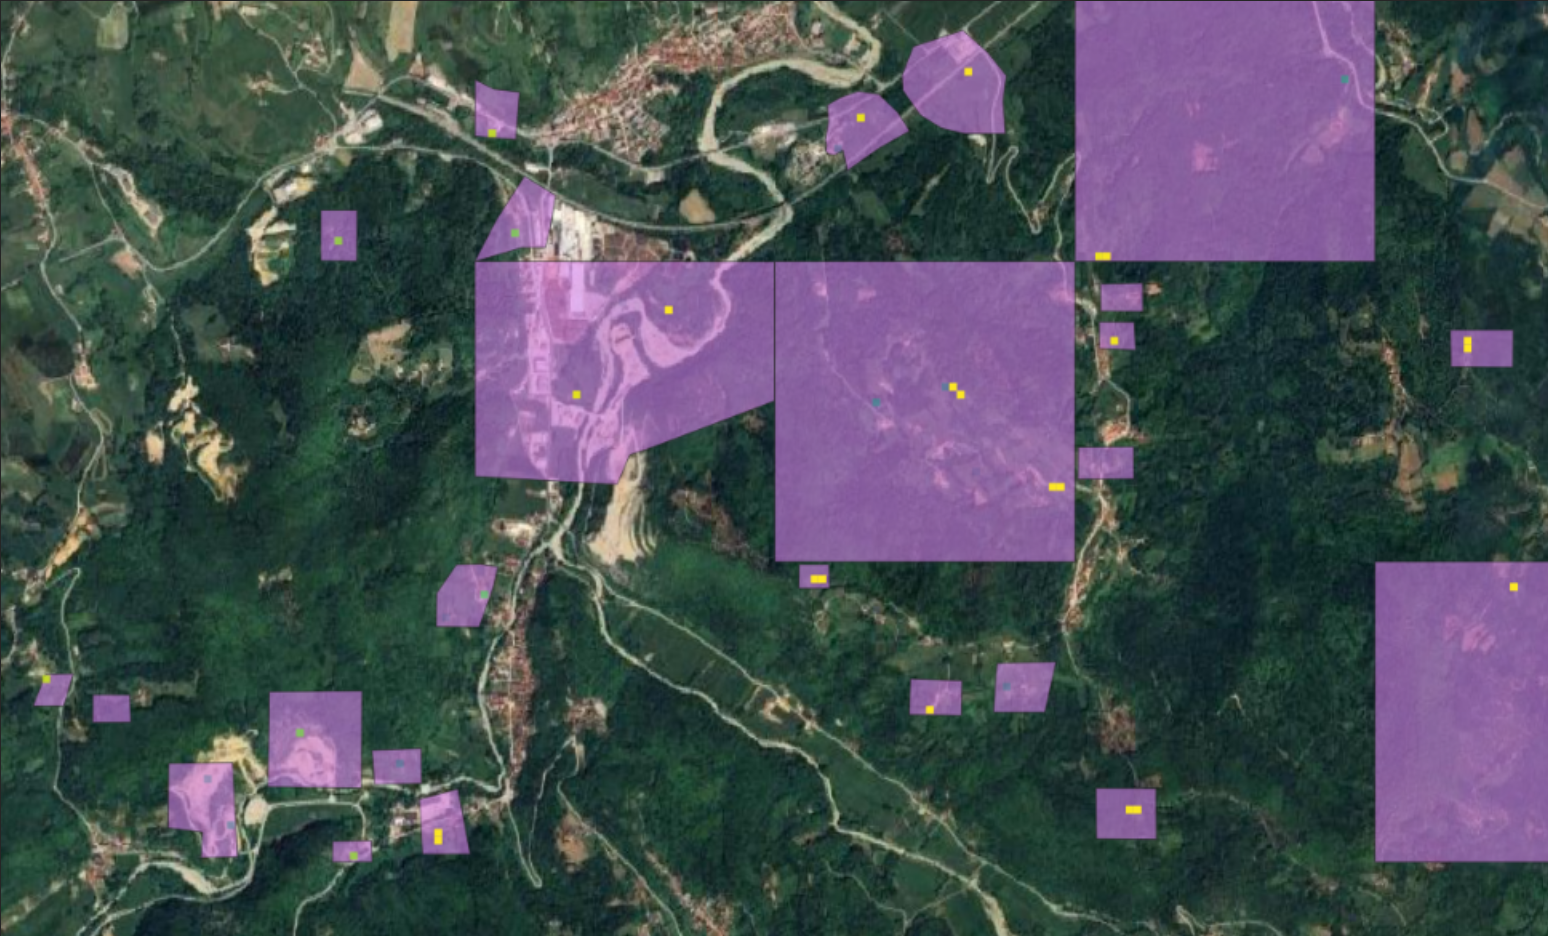 In figure: model-assisted annotation. Yellow points indicate high-activation patches proposed by the model; purple polygons show the manually verified Areas of Interest.
Live Demo
Explore the solution interactively: run the detection pipeline on VHR imagery and inspect the localized beehives.
Try it out
Try out the solution on Hugging Face Spaces:
Integration
The pipeline is containerised and deployed as a microservice within the SAiBees platform for automated processing of new VHR imagery. Detected beehive locations are stored as georeferenced vector features in the Geospatial Data Repository and exposed through the API Gateway and the web-based Dashboard for visualisation and downstream analysis.